Día 19: 5 minutos
Mapa en 5 minutos y día de elecciones en Argentina. No hay mucho más que decir
rnaturalearth::ne_countries(continent = "South America", returnclass = "sf") %>%
  ggplot() +
  geom_sf(aes(fill = !(admin %in% c("Argentina", "Falkland Islands")))) +
  scale_fill_manual(values = c("darkorange", "grey98"), labels = c("Acá se puede ir todo a la miercole",
                                                                   "Acá no")) +
   labs(x = NULL, y = NULL, fill = NULL,
       title = "Día de elecciones en Argentina") +
  theme_void(base_size = 10,
                base_family = "Roboto Condensed Light") +
  theme(plot.title = element_text(face = "bold"),
        plot.margin = unit(c(0.3, 0.3, 0.3, 0.3), "cm"),
        legend.position = c(0.8, 0.2))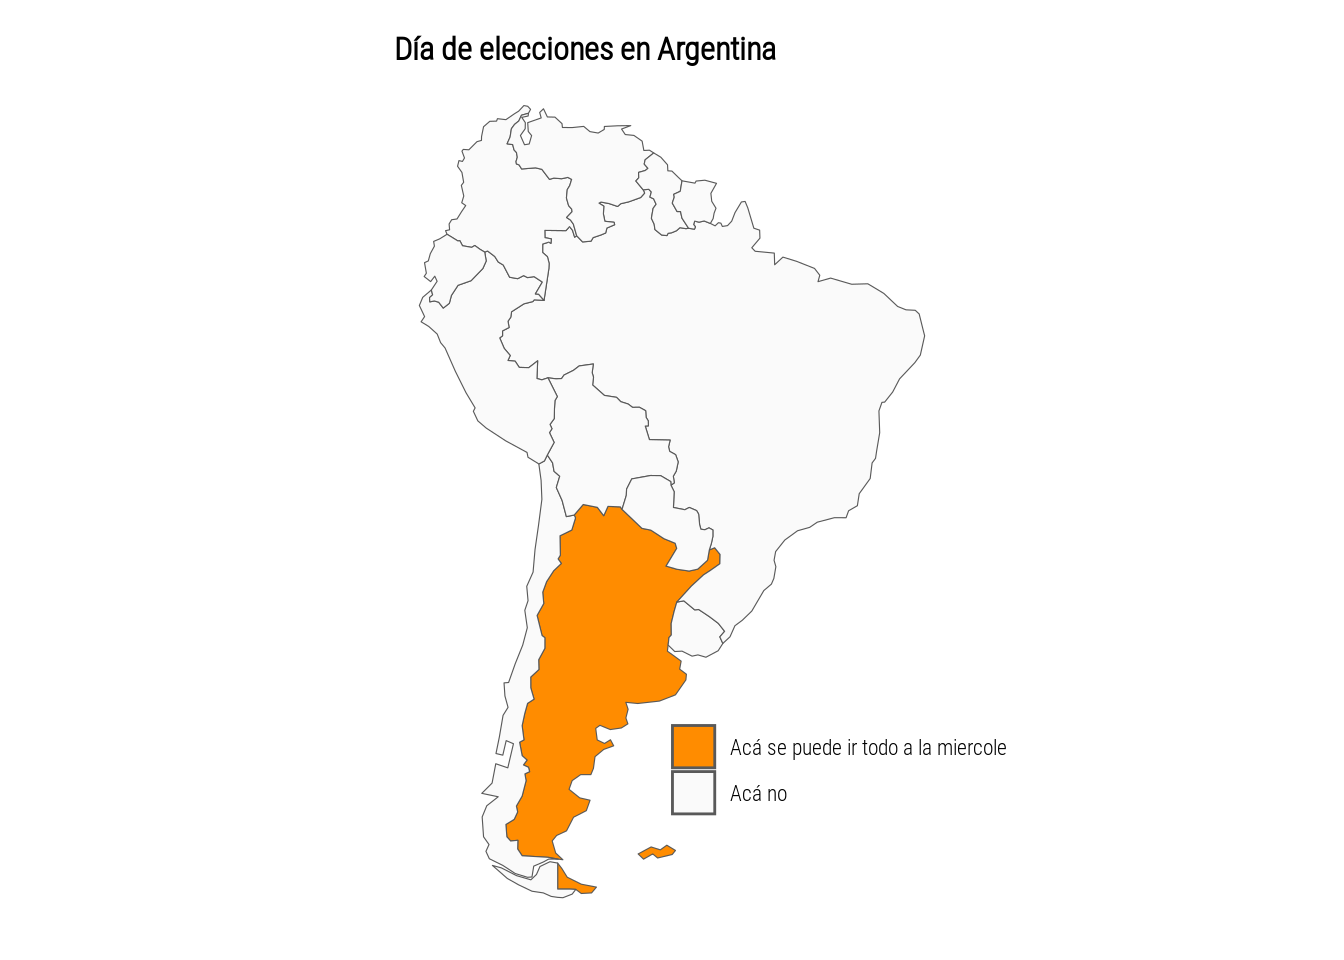
# ggsave("day19.png", device = png, type = "cairo", bg = "white", width = 10, height = 14, units = "cm", dpi = 150)